A failing test from Post #11 tells you that something is wrong. It does not tell you why — and the gap between those two things is where most developer time actually goes. The instinct almost everyone starts with is sprinkling print() statements through the suspicious-looking code, running it again, staring at the output, guessing, and repeating — a process that works for trivial bugs and becomes genuinely painful the moment a bug is subtle, intermittent, or buried several function calls deep.
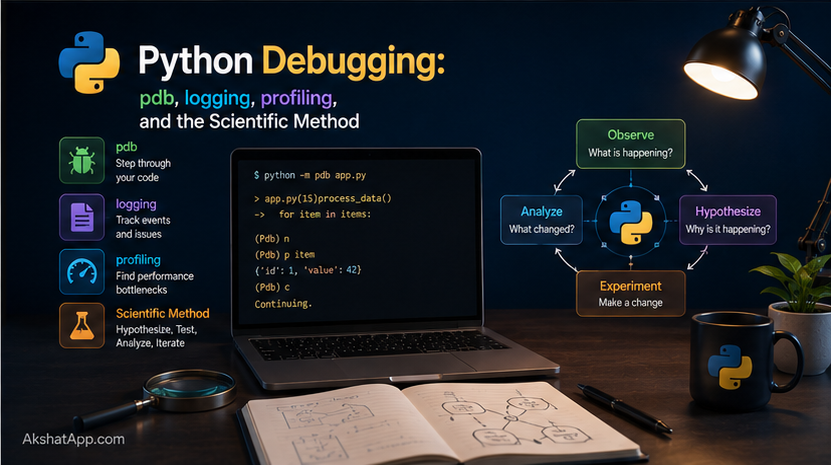
This post covers the tools that replace guesswork with a systematic process: Python’s built-in debugger for pausing execution and inspecting exactly what is happening at any given line, the logging module as the production-grade replacement for scattered print() calls, a brief introduction to profiling for when the bug is actually a performance problem rather than a correctness one, and — underlying all of it — the scientific method applied directly to hunting down bugs.
The Mental Model: Debugging as a Scientific Process
Effective debugging follows the same structure as the scientific method, applied to a much smaller, more concrete question:
Reproduce: Get the bug happening reliably, on demand. A bug you cannot reliably trigger is a bug you cannot reliably confirm you have actually fixed.
Hypothesize: Form a specific, falsifiable guess about the cause — not “something is wrong with the loop,” but “I believe total is being modified inside the if block on an iteration where it shouldn’t be.”
Test the hypothesis: Add a breakpoint, a log statement, or a targeted print exactly where your hypothesis predicts the problem lives, and check whether the evidence actually supports it.
Refine or confirm: If the evidence contradicts your hypothesis, that is genuinely useful information — it rules something out and narrows the search. Form a new, more specific hypothesis and repeat.
The failure mode this structure prevents is the most common unproductive debugging pattern: randomly changing code, rerunning, and hoping — without ever forming a clear prediction about what you expect to see, which makes it impossible to learn anything concrete from a run that does not fix the problem.
A Genuinely Subtle Bug to Debug
Here is a function with a real bug — not a typo, something that runs without crashing and produces a plausible-looking, wrong answer:
def calculate_order_total(items: list[dict]) -> float:
    """Calculate total cost, with a 10% discount on orders over $100."""
    total = 0
    for item in items:
        total += item["price"] * item["quantity"]
        if total > 100:
            total = total * 0.9
    return total
items = [
{"price": 30, "quantity": 2},
{"price": 50, "quantity": 1},
{"price": 20, "quantity": 1},
]
print(calculate_order_total(items))
# 107.10999999999999 — but the correct discounted total should be 108.0This runs without any error. The number even looks approximately right. It is still wrong — and why it is wrong is exactly the kind of thing worth working through systematically rather than staring at the code hoping the bug jumps out.
print() Debugging: The Baseline, and Its Limits
def calculate_order_total(items):
    total = 0
    for item in items:
        total += item["price"] * item["quantity"]
        print(f"After item: total={total}")  # manual debug print
        if total > 100:
            total = total * 0.9
            print(f"Discount applied: total={total}")  # another one
    return total
After item: total=60
After item: total=110
Discount applied: total=99.0
After item: total=119.0
Discount applied: total=107.1That output, read carefully, actually reveals the bug: the discount is being applied twice — once when total crosses 100 partway through the loop, and again on the next iteration, because the if total > 100: check runs on every iteration, not just once at the end. print() debugging found this bug, and for a function this short, it worked fine. Its real limitation shows up at scale: every debug print requires editing the source code, requires remembering to remove it afterward (leftover debug prints in committed code are a genuine, common embarrassment), and becomes unmanageable once you need to inspect many variables across many function calls simultaneously.
pdb: Python’s Built-In Debugger
pdb pauses execution at a specific point and gives you an interactive prompt — inspect any variable, step through code line by line, and explore the actual running state of your program, without editing a single line of source code to add temporary print statements.
def calculate_order_total(items):
    total = 0
    for item in items:
        total += item["price"] * item["quantity"]
        breakpoint()  # execution pauses here, every time this line runs
        if total > 100:
            total = total * 0.9
    return total
breakpoint() is a built-in function (Python 3.7+) that drops you directly into the pdb debugger at that exact line, every time it executes:
> calculate_order_total.py(5)calculate_order_total()
-> if total > 100:
(Pdb) p total
110
(Pdb) n
> calculate_order_total.py(6)calculate_order_total()
-> total = total * 0.9
(Pdb) n
> calculate_order_total.py(3)calculate_order_total()
-> for item in items:
(Pdb) c
Essential pdb Commands
| Command | Meaning |
|---|---|
n (next) |
Execute the current line, move to the next one |
s (step) |
Step into a function call on the current line, rather than over it |
c (continue) |
Resume normal execution until the next breakpoint (or the program ends) |
p variable_name |
Print the current value of a variable |
l (list) |
Show the source code around the current line |
w (where) |
Show the call stack — how execution got to this point |
q (quit) |
Exit the debugger entirely |
Stepping through with n and checking p total at each iteration makes the bug undeniable: total gets discounted, then more items get added on top of the already-discounted running total, and if it crosses 100 again, it gets discounted a second time. The if check has no business being inside the loop at all — the discount should be evaluated once, against the final total.
The Fix
def calculate_order_total(items: list[dict]) -> float:
    """Calculate total cost, with a 10% discount on orders over $100."""
    total = 0
    for item in items:
        total += item["price"] * item["quantity"]
    if total > 100:
        total = total * 0.9
    return total
Moving the discount check outside the loop — evaluated once, after the full total is known — fixes it:
print(calculate_order_total(items)) # 108.0 — correctlogging: The Production-Grade Replacement for print()
print() debugging is fine for quick, temporary investigation. It is the wrong tool for anything that needs to persist — understanding what a running production program actually did, hours or days after the fact, when you cannot attach a debugger to it at all.
import logging

logging.basicConfig(
    level=logging.DEBUG,
    format="%(asctime)s [%(levelname)s] %(message)s"
)
logger = logging.getLogger(__name__)


def calculate_order_total(items: list[dict]) -> float:
    total = 0
    logger.debug(f"Starting calculation for {len(items)} items")

    for item in items:
        total += item["price"] * item["quantity"]
        logger.debug(f"Running total: {total}")

    if total > 100:
        logger.info(f"Discount applied: {total} -> {total * 0.9}")
        total = total * 0.9

    logger.info(f"Final total: {total}")
    return total
2026-06-20 09:14:02 [DEBUG] Starting calculation for 3 items
2026-06-20 09:14:02 [DEBUG] Running total: 60
2026-06-20 09:14:02 [DEBUG] Running total: 110
2026-06-20 09:14:02 [DEBUG] Running total: 130
2026-06-20 09:14:02 [INFO] Discount applied: 130 -> 117.0
2026-06-20 09:14:02 [INFO] Final total: 117.0The Five Standard Log Levels
| Level | When to use it |
|---|---|
DEBUG |
Detailed diagnostic information, useful only while actively investigating something |
INFO |
Confirmation that things are working as expected — routine, normal events |
WARNING |
Something unexpected happened, but the program can continue |
ERROR |
A real problem — some specific operation failed |
CRITICAL |
A serious error — the program itself may be unable to continue |
The genuine advantage over print(): log level filtering. Set level=logging.INFO in production and every logger.debug(...) call is automatically silenced, with zero code changes — the detailed diagnostic logging remains right there in the code, ready to be switched back on (level=logging.DEBUG) the moment you actually need it, without editing or redeploying anything. print() offers no equivalent of this — every print statement always prints, everywhere, forever, until someone manually removes it.
A Brief Introduction to Profiling
Not every bug is about correctness — sometimes code produces the right answer, just too slowly. Profiling identifies where time is actually being spent, which is frequently not where intuition suggests.
import cProfile

def slow_function():
    total = 0
    for i in range(1_000_000):
        total += i ** 2
    return total

cProfile.run('slow_function()')
4 function calls in 0.089 seconds
Ordered by: standard name
ncalls tottime percall cumtime percall filename:lineno(function)
1 0.089 0.089 0.089 0.089 script.py:3(slow_function)
1 0.000 0.000 0.089 0.089 <string>:1(<module>)This is intentionally a light introduction — cProfile’s output, reading call counts and cumulative time across dozens of functions in a real application, and the broader discipline of measuring before optimizing rather than guessing where the slow part is, gets full treatment in Post #17. The point to internalize now: never guess about performance. The part of a program developers assume is slow and the part that is actually slow are frequently different pieces of code entirely, and profiling is the only reliable way to tell them apart.
The Scientific Method, Applied to the Order Total Bug
Walking through the actual process used above, made explicit:
1. Reproduce: The bug reproduces every time with the exact three-item list shown — not intermittent, not environment-dependent, a good, tractable starting point.
2. Hypothesize: Looking at the code before touching the debugger, a specific hypothesis: “I suspect the discount is being applied more than once, because the if check is inside the loop rather than after it.”
3. Test the hypothesis: breakpoint() placed right after the discount check, stepping through with n, watching total with p total at each iteration — directly confirming or refuting the specific prediction, not just poking around randomly.
4. Confirm: The debugger output directly showed total being discounted, then more items added on top of the discounted amount, then discounted again — exactly matching the hypothesis.
5. Fix and verify: Moving the if check outside the loop, then re-running against the known example to confirm the corrected output (108.0) matches hand-calculated expectations.
6. Prevent regression: The natural final step, directly connecting back to Post #11 — write a test that would have caught this bug the first time:
def test_discount_applied_once_not_per_item():
    """Regression test for a bug where the discount stacked per-item
    instead of applying once to the final total."""
    items = [
        {"price": 30, "quantity": 2},
        {"price": 50, "quantity": 1},
        {"price": 20, "quantity": 1},
    ]
    assert calculate_order_total(items) == 108.0
A bug found through careful debugging and then never protected by a test is a bug that can silently return the next time someone touches this code. Closing the loop from “found it” to “it can never come back unnoticed” is what turns one-off debugging into lasting code quality.
Real-World Use Cases
Investigating a failing test: Post #11’s test failures tell you exactly what was expected versus what happened — breakpoint() placed inside the function under test is frequently the fastest way from “this test fails” to “I understand precisely why.”
Understanding unfamiliar code: Stepping through someone else’s function with pdb, watching variables change in real time, is often a faster way to genuinely understand what a piece of code does than reading it silently — especially for anything with non-obvious control flow.
Diagnosing production issues: logging — not print() — is how real production systems record what actually happened, so that when something goes wrong at 2 AM, there is a trail to investigate the next morning without needing to have been watching in real time.
Performance troubleshooting: A brief cProfile run before optimizing anything prevents the common, wasted effort of speeding up a part of the program that was never actually the bottleneck in the first place.
Common Mistakes and Gotchas
⚠️ Mistake 1: Guessing and changing code randomly instead of forming a hypothesis Changing a line, rerunning, and hoping — without a specific prediction about what should happen if your theory is correct — teaches you very little from either outcome. A clear hypothesis, tested deliberately, narrows the search space with every attempt, whether it turns out right or wrong.
⚠️ Mistake 2: Leaving debug print() statements in committed code
A stray print(f"DEBUG: {value}") left in after a bug is fixed clutters output for everyone who runs the program afterward. logging at the DEBUG level, left permanently in place but filtered out by default, solves this properly — the diagnostic capability stays available without any ongoing cost.
⚠️ Mistake 3: Using print() instead of logging for anything meant to persist
print() output disappears the moment a terminal closes and offers no timestamps, no severity levels, and no easy way to redirect it to a file for later inspection. Anything beyond a five-minute local investigation belongs in logging, not print().
⚠️ Mistake 4: Trying to fix a bug you have not actually reproduced reliably “Sometimes it happens” is not yet a debuggable bug report — the first job, before any tool in this post gets used, is finding the specific, repeatable conditions under which the problem reliably occurs.
⚠️ Mistake 5: Optimizing code based on assumption rather than profiling data Spending an afternoon rewriting a function you assume is the bottleneck, without having actually profiled the program first, frequently optimizes something that was never meaningfully slow to begin with — while the real bottleneck, elsewhere entirely, remains untouched.
Performance Note
logging calls, even ones filtered out by the current log level, still carry a small cost — the log message’s string (particularly an f-string, which evaluates immediately regardless of whether the resulting log line is ultimately emitted) gets built every single time the line executes, even if that message never actually gets recorded anywhere. For genuinely hot code paths, the %-style lazy formatting (logger.debug("value: %s", value) rather than logger.debug(f"value: {value}")) defers that string construction until it is actually needed — a micro-optimization worth knowing exists, not something to worry about while the fundamentals in this post are still settling in.
Quick Reference
# pdb
breakpoint()  # pause execution here

# pdb commands (typed at the (Pdb) prompt)
n     # next line
s     # step into a function call
c     # continue until next breakpoint
p x    # print variable x
l      # list surrounding source code
w      # show the call stack
q      # quit the debugger

# logging
import logging
logging.basicConfig(level=logging.DEBUG, format="%(asctime)s [%(levelname)s] %(message)s")
logger = logging.getLogger(__name__)

logger.debug("detailed diagnostic info")
logger.info("routine confirmation")
logger.warning("unexpected, but recoverable")
logger.error("a real problem occurred")
logger.critical("the program may not be able to continue")

# Profiling (preview — full coverage in Post #17)
import cProfile
cProfile.run('some_function()')
Exercises
Exercise 1 — Direct application
Use breakpoint() to step through word_frequency() from Post #5 with a short sample string, watching the dictionary build up one word at a time with p at each step.
Exercise 2 — Slight variation
Add logging calls to get_exchange_rate() from Post #10 — log at DEBUG level before making the request, and at INFO level once the rate is successfully retrieved, or at ERROR level if it fails.
Exercise 3 — Real-world combination
Here is a deliberately buggy function: def running_average(numbers): total = 0; for n in numbers: total += n; return total / len(numbers). It crashes on an empty list. Use the scientific method structure from this post — reproduce, hypothesize, test, confirm — to diagnose exactly why, then fix it properly using exception handling from Post #7.
Exercise 4 — Open-ended challenge Take a bug you have genuinely encountered in your own code — from any exercise in this series so far — and write down, in plain English, the actual hypothesize-test-confirm sequence you went through (or would go through now, applying this post) to find and fix it. Then write the regression test that would catch it if it ever came back.
FAQ
Q: Is using a debugger “cheating” compared to just reading the code carefully? A: No — reading code carefully is valuable and often sufficient for simple bugs, but a debugger gives you ground truth about what a program actually did on a specific run, which is frequently different from what careful reading alone would predict, especially once state, loops, and multiple function calls are involved.
Q: Should I remove breakpoint() calls before committing code?
A: Yes, always — a breakpoint() accidentally left in code that later runs in production will pause execution and hang, waiting for interactive input that will never come. This is different from logging.debug() calls, which are safe to leave in permanently since they can simply be filtered by log level.
Q: What’s the actual difference between logging.info() and print() if both just show text?
A: logging adds timestamps, severity levels, and the ability to filter or redirect output (to a file, to a monitoring system, silenced entirely) without touching the code that generates it. print() does none of this — it always writes directly to the terminal, unconditionally, with no metadata at all.
Q: How do I debug code running somewhere I can’t easily attach an interactive debugger, like a deployed server?
A: This is exactly the situation logging is designed for — recording enough detail as the program runs that you can reconstruct what happened after the fact, from log output alone, without needing to have been present with a debugger attached at the exact moment something went wrong.
Summary and Next Steps
You can now pause and step through running code with pdb rather than relying entirely on scattered print() statements, use logging with appropriate severity levels for anything meant to persist beyond a quick local investigation, understand what profiling is for (with the full depth deferred to Post #17), and — most importantly — approach an unfamiliar bug with a structured, hypothesis-driven process rather than random guessing. The order-total bug in this post is fixed, understood, and protected by a regression test, closing the loop from Post #11’s testing coverage.
Your next step: Complete Exercise 3 — debugging the running_average crash on an empty list — and specifically write out your hypothesis in a sentence before touching the debugger, then check afterward whether the evidence actually confirmed it. That discipline, forming a falsifiable prediction before investigating, is the single habit this entire post has been building toward.
The next post shifts from tools for finding problems to a different way of thinking about solving them: functional programming, treating functions themselves as data to be passed around, combined, and transformed.
Code tested with Python 3.13. Last updated: June 2026.
Share This Post

Join our newsletter!
Get the latest developer guides, tutorials, and tips delivered straight to your inbox.