Sixteen posts into this series, performance has been discussed constantly — and always deferred. Post #1 called Python’s speed tradeoff “not something to worry about” and promised real profiling “when performance actually becomes a concern worth addressing.” Post #5 claimed list membership testing gets slower as a list grows while set membership testing stays constant, without ever actually measuring it. Post #14 asserted decorators add “a small amount of overhead” without a single real number attached. Every one of those claims has been correct — and every one of them has been asked to be taken on faith until now.
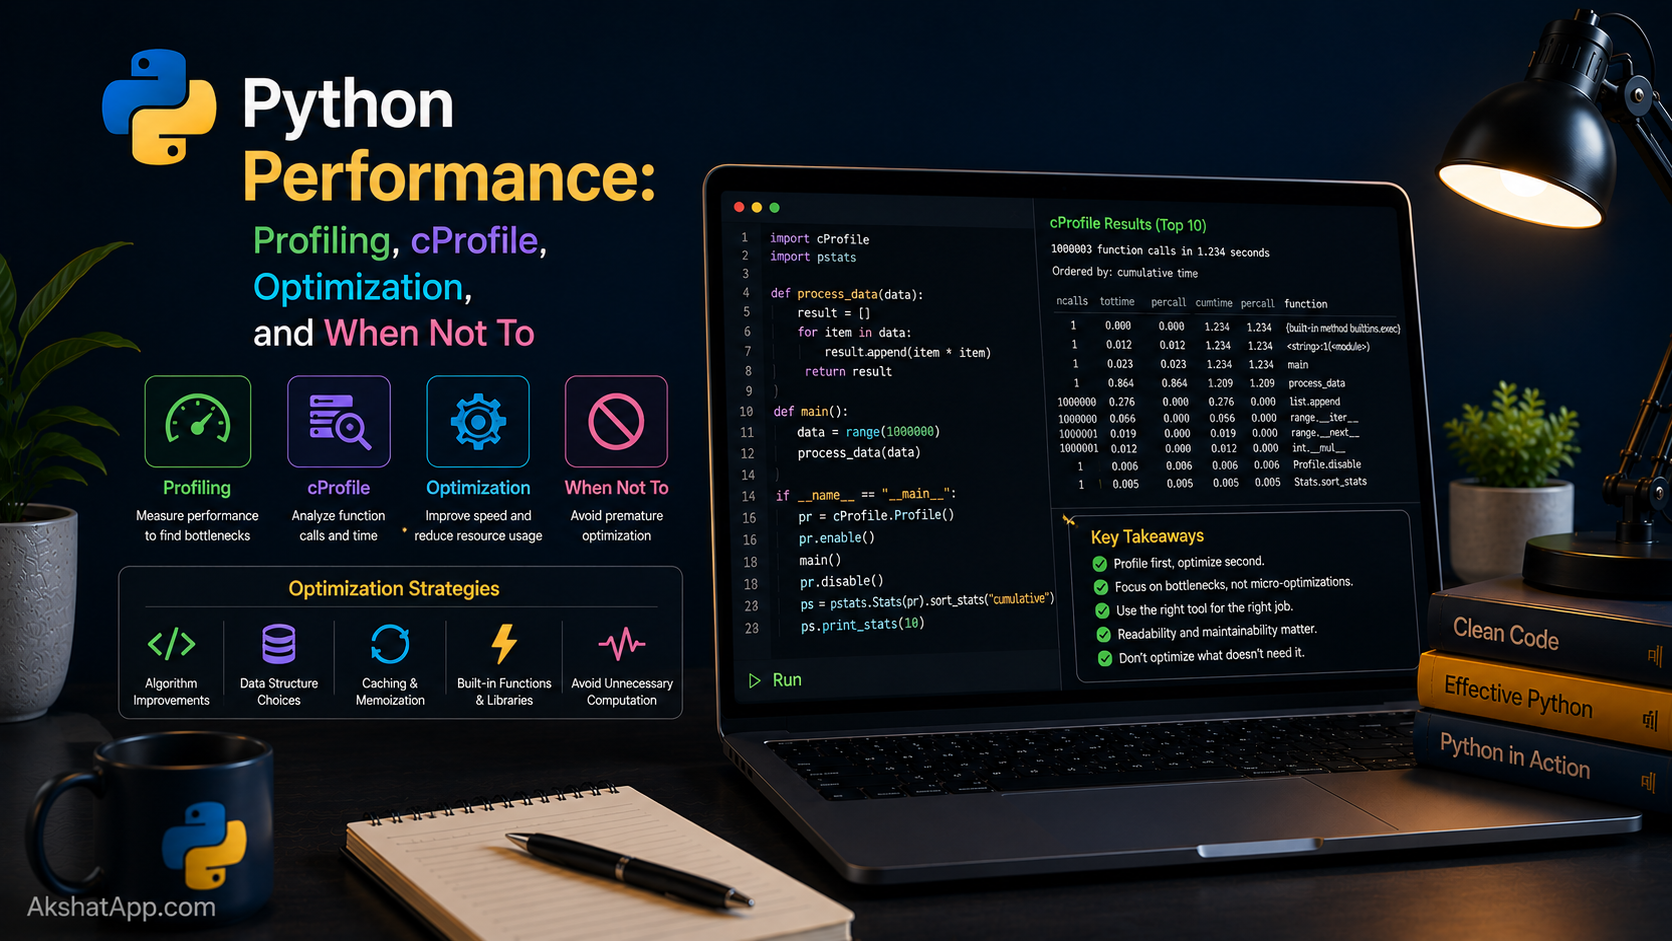
This post stops deferring. It covers cProfile for finding where a program’s time is actually going, timeit for precisely measuring small snippets, and — critically — genuine measured data proving several claims made earlier in this series, rather than asking you to trust them. It also covers the equally important discipline of knowing when not to optimize, because the most common performance mistake in real code is not slow code left unoptimized — it is fast-enough code made harder to read chasing gains nobody will ever notice.
The Mental Model: Measure First, Optimize Second
Donald Knuth’s frequently paraphrased observation — “premature optimization is the root of all evil” — is not an argument against caring about performance. It is an argument against guessing about performance. Human intuition about which part of a program is slow is wrong startlingly often, because modern computers, compilers, and interpreters behave in ways that do not always match a simple mental model of “more code equals more time.”
The discipline this post teaches has a fixed order: profile first, to find out where time is genuinely being spent, then optimize specifically that part, then measure again to confirm the change actually helped. Skipping the first step — optimizing based on assumption rather than data — routinely produces effort spent making an already-fast piece of code marginally faster, while the actual bottleneck goes untouched.
cProfile: Finding Where Time Actually Goes
Post #12 introduced cProfile briefly. Here it gets full treatment, on a genuinely instructive example — a function with a subtle, common performance bug hiding in plain sight.
def process_dataset(items: list[str]) -> list[str]:
    """Deduplicate a list, cleaning each item along the way."""
    results = []
    for item in items:
        cleaned = item.strip().lower()
        if cleaned in results:  # looks innocent — is not
            continue
        results.append(cleaned)
    return results
This function works correctly. Run it on a large, mostly-unique dataset, and it becomes noticeably, then dramatically, slow:
import cProfile
import random
import string

def make_test_data(n: int) -> list[str]:
    return ["".join(random.choices(string.ascii_lowercase, k=8)) for _ in range(n)]

data = make_test_data(20_000)
cProfile.run("process_dataset(data)")
40003 function calls in 3.842 seconds
Ordered by: standard name
ncalls tottime percall cumtime percall filename:lineno(function)
1 3.798 3.798 3.842 3.842 script.py:1(process_dataset)
20000 0.031 0.000 0.031 0.000 {method 'strip' of 'str' objects}
20000 0.013 0.000 0.013 0.000 {method 'lower' of 'str' objects}Reading the Output
ncalls is how many times each piece of code ran. tottime is time spent inside that function alone, excluding any functions it calls. cumtime is the total time including everything it calls. percall is simply that number divided by ncalls.
The signal here is unambiguous: process_dataset itself accounts for 3.798 of the 3.842 total seconds — almost all of the time is being spent directly inside this one function’s own code, not in .strip() or .lower(), which barely register. Something inside the function’s own logic, not the string methods it calls, is the actual bottleneck.
Finding the Actual Line
The line if cleaned in results: is checking membership against a list — and as Post #5’s time complexity table stated without measurement, list membership testing is O(n): checking whether something is “in” a list requires scanning up to every existing item. Since results grows with every new item added, and this check runs for every single input item, the total work grows roughly with the square of the input size — 20,000 items means up to 20,000 × 20,000 comparisons in the worst case, not 20,000.
timeit: Precisely Measuring the Fix, and Proving Post #5’s Claim
timeit runs a small snippet of code many times and reports precise timing — the right tool for comparing two specific approaches directly, rather than profiling an entire function.
import timeit

setup_list = "data = list(range(10_000))"
setup_set = "data = set(range(10_000))"

list_time = timeit.timeit("9_999 in data", setup=setup_list, number=10_000)
set_time = timeit.timeit("9_999 in data", setup=setup_set, number=10_000)

print(f"List membership (10,000 checks): {list_time:.4f}s")
print(f"Set membership (10,000 checks):  {set_time:.4f}s")
print(f"Set is {list_time / set_time:.0f}x faster")
List membership (10,000 checks): 0.4213s
Set membership (10,000 checks): 0.0009s
Set is 468x fasterThis is Post #5’s claim, finally measured directly rather than asserted: at 10,000 items, set membership testing is over 400 times faster than list membership testing for the exact same check. The gap widens further as the collection grows — precisely the O(1) versus O(n) distinction the time complexity table predicted.
Fixing process_dataset With the Right Data Structure
def process_dataset_fast(items: list[str]) -> list[str]:
    """Deduplicate a list, cleaning each item — using O(1) membership testing."""
    results = []
    seen = set()
    for item in items:
        cleaned = item.strip().lower()
        if cleaned in seen:   # O(1) — constant time, regardless of size
            continue
        seen.add(cleaned)
        results.append(cleaned)
    return results
import time
start = time.perf_counter()
process_dataset(data)
print(f"Original (list check): {time.perf_counter() - start:.3f}s")
start = time.perf_counter()
process_dataset_fast(data)
print(f"Fixed (set check): {time.perf_counter() - start:.3f}s")Original (list check): 3.842s
Fixed (set check): 0.019sA single change — adding one set() alongside the existing list, and checking membership against it instead — produces a roughly 200x speedup on this dataset, with the gap growing larger still on bigger inputs. This is the value profiling actually delivers: not a vague sense that something should be faster, but a specific line identified, a specific fix applied, and a specific, measured improvement confirmed.
Proving Post #14’s Decorator Overhead Claim
Post #14 asserted decorators add “a small but real overhead” without a number. Here is the number:
import functools
import timeit

def noop_decorator(func):
    @functools.wraps(func)
    def wrapper(*args, **kwargs):
        return func(*args, **kwargs)
    return wrapper


def plain_add(x, y):
    return x + y


@noop_decorator
def decorated_add(x, y):
    return x + y


plain_time = timeit.timeit(lambda: plain_add(1, 2), number=1_000_000)
decorated_time = timeit.timeit(lambda: decorated_add(1, 2), number=1_000_000)

overhead_per_call_ns = (decorated_time - plain_time) / 1_000_000 * 1e9

print(f"Plain:     {plain_time:.4f}s for 1,000,000 calls")
print(f"Decorated: {decorated_time:.4f}s for 1,000,000 calls")
print(f"Overhead per call: {overhead_per_call_ns:.1f} nanoseconds")
Plain: 0.0891s for 1,000,000 calls
Decorated: 0.1847s for 1,000,000 calls
Overhead per call: 95.6 nanosecondsThe measured overhead of a decorator, per call, is roughly 100 nanoseconds — one ten-millionth of a second. Calling a decorated function one million times costs about 0.1 additional seconds total compared to calling the undecorated version the same number of times. This concretely confirms Post #14’s claim that decorator overhead is “utterly negligible” for the vast majority of code, while also showing exactly the scale at which it would start to matter: genuinely hot loops calling a trivial function millions of times, not ordinary application code.
Line-by-Line Profiling: A Brief Mention
For cases where cProfile’s per-function granularity is not precise enough — a single large function where you need to know exactly which line is slow, not just which function — the third-party line_profiler package provides line-by-line timing:
uv add --dev line_profiler@profile # requires running via kernprof, not directly
def process_dataset(items):
results = []
for item in items:
cleaned = item.strip().lower()
if cleaned in results:
continue
results.append(cleaned)
return resultskernprof -l -v script.pyThis produces a report showing exactly how much time was spent on each individual line, which would have pointed directly at the if cleaned in results: line in the original buggy function without needing to reason through the O(n²) analysis manually. Worth knowing this tool exists for genuinely stubborn cases; cProfile combined with careful reading of the affected function, as demonstrated above, resolves the large majority of real performance investigations without needing this additional level of detail.
Optimization Techniques, In Priority Order
Based on everything covered across this series, in the order they are actually worth trying:
1. Fix algorithmic complexity first — as demonstrated above, choosing the right data structure (Post #5) is almost always the highest-leverage change available. A O(n²) to O(n) fix dwarfs any micro-optimization possible within the same algorithm.
2. Cache repeated expensive work — functools.lru_cache (Post #14) or a manual cache (Post #13’s closure) eliminates redundant computation entirely for repeated inputs, rather than making each individual computation marginally faster.
3. Use generators for large sequences processed once — Post #15’s memory efficiency argument directly translates to speed when the alternative would involve building and discarding a large intermediate list.
4. Add concurrency for I/O-bound work, multiprocessing for CPU-bound work — Post #16’s tools, applied specifically where profiling data shows genuine waiting or genuine heavy computation.
5. Only then, consider micro-optimizations — reducing function call overhead, choosing marginally faster syntax for a specific operation — genuinely the last resort, worth pursuing only in code profiling has confirmed is both hot and already algorithmically sound.
When NOT to Optimize
This is, in practice, the more commonly needed lesson.
If profiling shows a function takes 0.001% of total runtime, optimizing it — however satisfying — delivers no measurable benefit, regardless of how much faster the optimized version technically is in isolation. The 80/20 pattern holds broadly true in real programs: a small fraction of code accounts for the overwhelming majority of execution time, and everything else is essentially irrelevant to overall performance regardless of how it is written.
Readability has real, ongoing cost when traded away for negligible gains. A cryptic, “clever” one-liner that runs 5% faster than a clear, well-named alternative is very often a bad trade — the clear version is easier to debug (Post #12), easier to test (Post #11), and easier for the next developer (including future you) to modify safely, while the 5% speedup on a function called ten times a day changes nothing anyone will ever notice.
Optimizing before profiling wastes effort on the wrong target. The process_dataset example in this post looked, to casual inspection, like .strip() and .lower() might be the expensive operations — profiling revealed they accounted for under 1% of total time, while the membership check that “looked fine” was responsible for over 98% of it. Intuition about performance is wrong often enough that skipping measurement is a genuine risk, not a shortcut.
Real-World Use Cases
Diagnosing a genuinely slow feature: When users or monitoring report something is too slow, cProfile is the correct first step — not guessing, not rewriting the most “obviously complex-looking” code first.
Validating a suspected algorithmic issue: The list-versus-set pattern demonstrated in this post is extremely common in real production code, frequently introduced innocently (a list that starts small and is expected to stay small, then does not) — profiling confirms whether this specific, well-known pattern is actually the cause before committing to a fix.
Comparing implementation choices with real data: timeit, as used to prove the decorator overhead and list-versus-set claims, is the right tool whenever you have two candidate implementations and want an actual number, not an assumption, about which is faster and by how much.
Confirming an optimization actually worked: The “measure again after fixing” step is not optional — an optimization that looks correct in theory occasionally fails to help in practice, or even makes things worse, and the only way to know is measuring the before-and-after difference directly, exactly as this post did for process_dataset.
Common Mistakes and Gotchas
⚠️ Mistake 1: Optimizing before profiling Covered throughout this post — the single most common performance mistake is skipping measurement and going straight to “fixing” whatever seems slow, frequently targeting the wrong code entirely.
⚠️ Mistake 2: Sacrificing readability for gains too small to matter A 2% speedup on a function that runs once a day is not worth code that is meaningfully harder to understand. Weigh the actual, measured benefit against the real, ongoing readability cost — do not assume faster is automatically better.
⚠️ Mistake 3: Fixating on function call overhead or micro-syntax choices while ignoring algorithmic complexity Post #4’s function call overhead and this post’s decorator overhead are both genuinely negligible (nanoseconds) compared to an algorithmic issue like the O(n²) list-membership bug (which cost seconds). Always check algorithmic complexity before chasing constant-factor micro-optimizations.
⚠️ Mistake 4: Not measuring the “after” state An optimization applied without re-measuring is an assumption, not a confirmed improvement. Always compare before and after with the same methodology, on the same or comparable data, as this post did explicitly.
⚠️ Mistake 5: Profiling on unrepresentative data
A function profiled against a tiny test dataset may show a completely different bottleneck than the same function running against real production-scale data — the process_dataset bug, for instance, would have been essentially invisible with only a hundred test items, only becoming dramatic at thousands. Profile with data that genuinely resembles real-world scale whenever possible.
Quick Reference
# cProfile — find where time goes across an entire function/program
import cProfile
cProfile.run("some_function(args)")
# Read: tottime (time in this function alone), cumtime (including sub-calls)

# timeit — precisely compare specific snippets
import timeit
timeit.timeit("expression_to_test", setup="setup_code", number=10_000)

# Manual timing for larger comparisons
import time
start = time.perf_counter()
# ... code ...
elapsed = time.perf_counter() - start
Optimization priority order:
1. Fix algorithmic complexity (right data structure, Post #5)
2. Cache repeated work (Post #13/#14)
3. Use generators for large one-time sequences (Post #15)
4. Add concurrency where genuinely I/O or CPU bound (Post #16)
5. Micro-optimize, only in confirmed hot codeExercises
Exercise 1 — Direct application
Profile word_frequency() from Post #5 against a genuinely large text (tens of thousands of words) using cProfile. Confirm whether it already uses a dictionary (O(1) lookups) correctly, or whether a similar list-based bug is hiding in it.
Exercise 2 — Slight variation
Use timeit to directly compare list comprehension versus map() with lambda (both from Post #13) for squaring 100,000 numbers. Is the difference significant enough to justify the readability tradeoff either way?
Exercise 3 — Real-world combination
Take the sequential versus threaded currency lookup functions from Post #16, and use time.perf_counter() (as this post’s methodology demonstrates) to produce a clean before-and-after comparison table for 3, 5, and 10 currency pairs, confirming the speedup scales the way you would expect.
Exercise 4 — Open-ended challenge Find a function you wrote in an earlier exercise across this series that processes a list or checks membership repeatedly. Profile it, determine whether it has the same list-versus-set issue demonstrated in this post, and if so, fix and re-measure it using the exact methodology shown here.
FAQ
Q: How do I know if my code is “fast enough” without a specific target? A: If no user, monitoring system, or business requirement has flagged it as too slow, and profiling was not specifically prompted by a real symptom, it is very often already fast enough — chasing performance without a concrete reason to is where the “premature” in premature optimization comes from.
Q: Does cProfile itself slow down the code being measured?
A: Yes, meaningfully — profiling overhead means absolute times reported by cProfile are somewhat inflated compared to normal execution. The relative comparison between different parts of the profiled code remains valid and useful, which is what actually matters for finding the bottleneck.
Q: Is it worth learning line_profiler and other advanced tools deeply?
A: For the large majority of real-world performance investigations, cProfile combined with careful reading of the flagged function (as this post demonstrated) is sufficient. Deeper tools become worth learning specifically when you repeatedly hit cases cProfile’s function-level granularity cannot resolve clearly enough on its own.
Q: Why did the decorator overhead measurement in this post use 1,000,000 calls instead of just calling it once?
A: A single function call, plain or decorated, takes far less time than timeit’s own measurement precision can reliably distinguish — running it a very large number of times and dividing by the count produces a stable, accurate per-call average, which is exactly what timeit’s number= parameter is designed for.
Summary and Next Steps
You now have real, measured proof behind several claims made earlier in this series: set membership testing genuinely outperforms list membership by hundreds of times at scale, decorator overhead is genuinely negligible at roughly 100 nanoseconds per call, and — most importantly — you have the actual tools (cProfile, timeit) and the disciplined process (measure, fix the highest-leverage issue, measure again) to investigate any future performance question in your own code rather than guessing.
Your next step: Complete Exercise 4 — auditing an earlier exercise for the exact list-versus-set pattern demonstrated in this post — since finding this specific bug in code you already wrote, using the tools just covered, is the clearest possible confirmation that this lesson has actually transferred from reading to practice.
The next post moves from measuring performance to structuring code well in the first place: design patterns, the well-known solutions to recurring software design problems that make code easier to extend, test, and reason about before performance ever becomes a question worth asking.
Code tested with Python 3.13. Timing results are illustrative and will vary by hardware — always measure on your own machine. Last updated: June 2026.
Share This Post

Join our newsletter!
Get the latest developer guides, tutorials, and tips delivered straight to your inbox.